Les fins d’années sont bien souvent l’occasion de faire des comptes. WordPress l’a fait de façon originale en envoyant un mail à tous les propriétaires de comptes WordPress.com. Comme c’est original, je ne résiste pas à la tentation de partager avec vous cette façon de présenter les chiffres. Par contre, c’est en anglais 😉 :
The stats helper monkeys at WordPress.com mulled over how this blog did in 2010, and here’s a high level summary of its overall blog health:
The Blog-Health-o-Meter™ reads Wow.
Crunchy numbers
The average container ship can carry about 4,500 containers. This blog was viewed about 14,000 times in 2010. If each view were a shipping container, your blog would have filled about 3 fully loaded ships.
In 2010, there were 44 new posts, growing the total archive of this blog to 71 posts. There were 115 pictures uploaded, taking up a total of 26mb. That’s about 2 pictures per week.
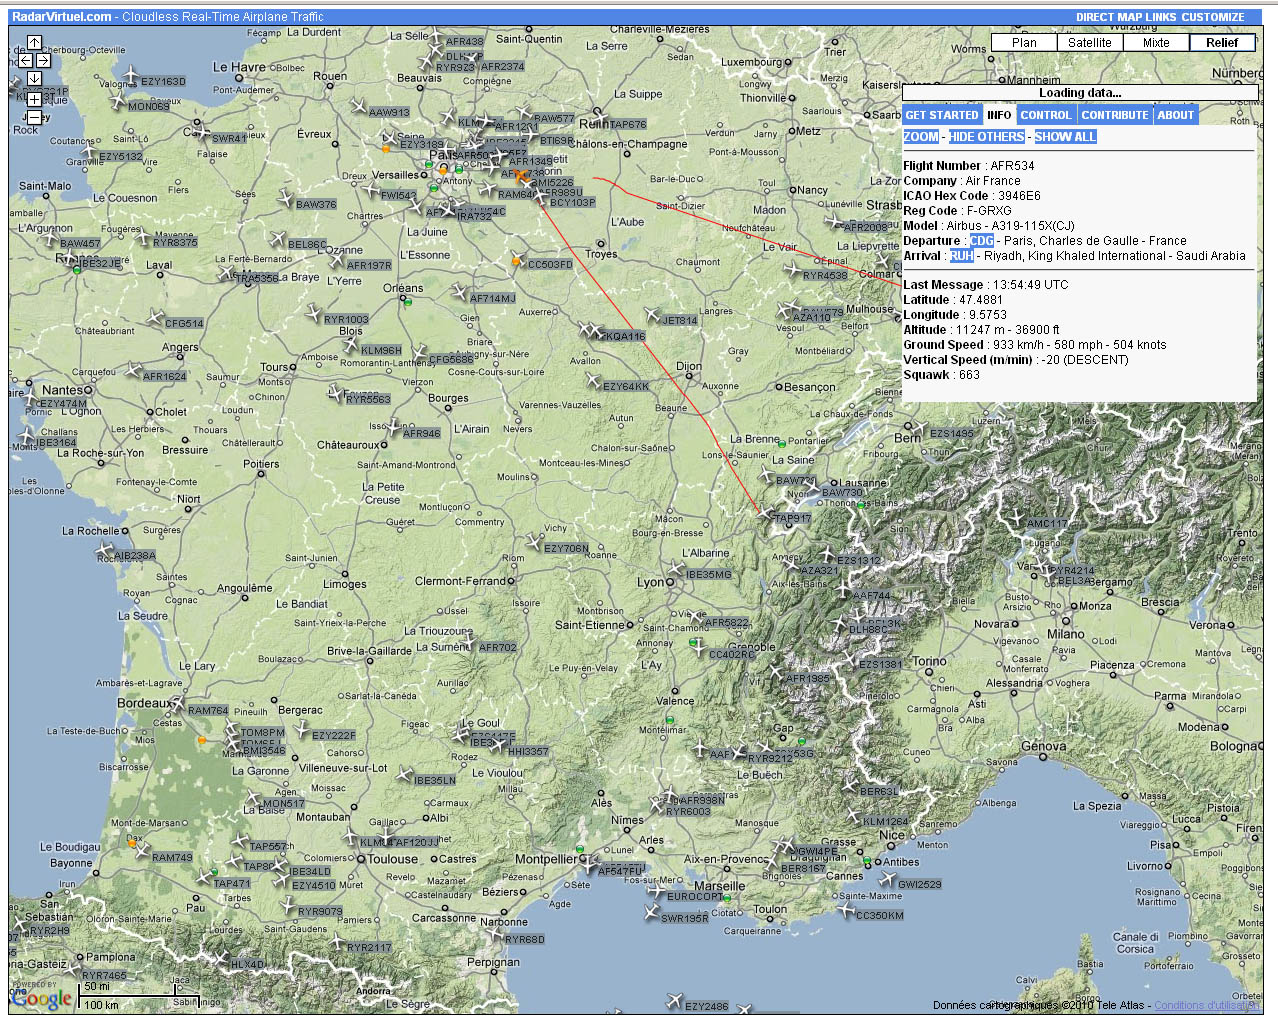
The busiest day of the year was April 19th with 403 views. The most popular post that day was Radar Virtuel.
Where did they come from?
The top referring sites in 2010 were lj35.blogspot.com, facebook.com, google.fr, forum.af001.com, and search.ke.voila.fr.
Some visitors came searching, mostly for radar virtuel, radar virtuel avion, radarvirtuel, montgolfiere, and volcan finlande.
Attractions in 2010
These are the posts and pages that got the most views in 2010.
1Radar Virtuel February 2010
2 comments2[Actu] Le ciel européen paralysé par… un volcan Islandais ! April 2010
3 comments3Masse & Centrage June 2009
11 comments4Data Logger GPS – Astuce & Utilisation sous Linux February 2010
4 comments5[Pub] Azzaro Chrome 2010 March 2010